Museums and the Web
An annual conference exploring the social, cultural, design, technological, economic, and organizational issues of culture, science and heritage on-line.

Abstract
Measuring online performance has been one of the hot topics for museum online professionals in the UK. Tate was one of the participants in the Culture24’s action research project, which focused on measuring online success. All participants agreed that reporting purely on the number of visits and time spent on the website fulfilled the governmental requirements, but has not necessarily helped to evaluate online presence against institutional objectives. We realised we had to start using the large amount of available metrics in a more intelligent way. In this paper we would like to present the steps we have taken to increase the benefits that analytics can bring to other institutions and have brought to Tate, and the challenges we met on the way of spreading the analytics culture across the organisation.
Keywords: metrics, analytics, evaluation, maturity model, organisational culture.
In most cases, museums stumble blindly into the world of analytics, and at first see metrics reporting as a peripheral activity, largely undertaken without a plan or dedicated resources. They thus miss the opportunity to fully understand the deep insights analytics can offer.
Analytics can be used by museums to easily find out which artworks, articles or videos are most popular and which aren’t, which e-mails are opened and which are not read, what advertisements are clicked on and what search terms bring traffic. They can even reveal the make of users’ phones and where they live. Moreover, through the inception of social engagement into the digital world, the museums can now get much deeper insights into their audiences. Although it is becoming increasingly difficult to make sense of metrics, can museums afford to miss out on these opportunities to better understand who their online audiences are and use that knowledge to fulfill their missions?
Along with another twenty cultural organisations, Tate took part in the Culture24-led research project, “How to measure online success.” All participants recognised that reporting solely on the number of visits and time spent on a website fulfills funding bodies’ requirements, but such statistics are unlikely to help the museums and other public institutions evaluate and improve their online presence against their organisational objectives (Finnis et al, 2011). But where do you start in order to make this shift and establish a culture of analytics in your museum?
If you are going to be serious about analytics, you must have a strategy driving your efforts. It takes more than just collecting facts to tell stories with numbers and not all stories are true or that useful. All too often the most important characters – the users – are nowhere to be found. Nikki Usher (2010) observes in the article for Nieman Journalism Lab, “that journalists, for too long, have been writing about what they think their readers ought to know, and not enough about what their audiences want to know.” The same could be applied to museums as publishers.
The information and the tools to capture the required information are widely available, but museums need to take a more mature and outward–looking approach to analytics, one that is led by their genuine wish to delivering an ultimate experience to their users. The main challenges still remain; firstly, the challenge of having more data than anyone has time to analyse and more objectives than anyone can possibly manage to act upon without further investment; and secondly, the challenge of transition within the organisation to adopt the analytics into its mainstream culture. In this paper we will attempt to present the steps we have taken to bring Tate closer to adopting a culture of analytics and the challenges we have met on the way.
As with anything you start doing for the first time, before introducing a new approach to analytics in your organisation, you need to start with some preparation work. There is little worse than encountering a new business activity without knowing where to begin and what to seek out. As Figure 1 shows, we broke the journey down into six steps or areas of activity.

Figure 1: Journey to a culture of analytics.
The first step in reworking your analytics programme is to assess where you are. There are different online analytics maturity models that may help guide you through this exercise, assessing your analytics management position from different angles. We used a model developed by the analytics expert Stephane Hamel. Hamel (2009) suggested six key process areas or managerial aspects to consider:
Applying Hamel’s model to analyse the state of our analytics management in 2010 and 2012 provided us with a critical framework from which to review where we started and what we had achieved.
In 2010, there was no analytics strategy and no one was responsible for managing the analytics at Tate (Figure 2). Webtrends, a log file–based reporting tool, was used to report page views and unique visitor figures on a monthly basis in a spreadsheet buried somewhere on Tate’s intranet. Meanwhile, the availability of the free Google Analytics service opened a whole new world of metrics, with immediate and user-friendly access to reports. However, Tate’s use of Google Analytics was based on settings configured by a number of different people on a project–by–project basis over a number of years. When we started analysing the metrics more closely, we realised the tool was not set up or used correctly and the reports were, to say the least, inaccurate.

Figure 2: Situation of analytics in 2010.
Then, a few factors sparked a complete overhaul of our thinking: participation in the aforementioned Culture24 project proved very useful in learning about the best practice for analytics set up and reporting, and around the same time, following the announcement of the new online strategy, we undertook a comprehensive redevelopment of the Tate website, which launched in 2012. After investing significant energy and time into addressing many of the issues, we now find ourselves in the situation as shown in Figure 3.

Figure 3: Situation of analytics in 2012.
We redefined the objectives and increased the scope of our approach to analytics. We started evaluating the management of analytics for Tate’s entire online ecosystem, not just the content we control on our website, various social media websites, apps and third–party sites, but also Tate content on other collaborative websites like Your Paintings and the Google Art Project. We made a decision to use solely Google Analytics for reporting on our website metrics. We spent a lot of time addressing data inaccuracies by making sure the site was fully tracked with a correct tracking code and that all the settings were optimised to our business needs. Now that we are in possession of the tools, resources and information we need, we are beginning to refine each area of activity and move from, as Hamel (2009) put it, an operational to an integrated level of maturity in the management of analytics. So critical has this work become for us that Tate now has a dedicated member of staff responsible for managing the metrics, communicating the findings and making recommendations to decision makers.
Once you understand where you are, the next step is to define where you want to go next. For any cultural shift to happen, you have to write your sacred manuscript: your strategic plan. This is the essential ingredient in communicating to the stakeholders the role and goals of analytics, key performance indicators that will be used to evaluate the success of your digital presence and the plan to get you there. Start by answering some key questions to help you form your strategic approach:
Your analytics strategic plan will carry more weight if you write it to dovetail with existing strategic documents and broader business activities. Tate’s Online Strategy, published in spring 2010, included a section on metrics, paving the way for more detailed and meaningful approach to statistics. It also defined a list of suggested metrics linked to each strategic goal, revenue generation, data capture, content aggregation, and user engagement (Stack, 2010). But the development of an analytics strategy is a continuous and iterative process that should organically evolve as the online ecosystem changes to support the organisation's overall aims.
Putting in place good governance and management structure will ensure a certain pattern of behaviour is followed within the organisation. However, when it comes to setting up the most effective governance and structure, no one size fits all. Which model will work best for you will depend on a number of factors, such as the size of your organisation, organisational structure, and overall culture.
We found the model for structuring the governance that Avinash Kaushik (2007) refers to as ‘centralised decentralisation’ to be the best overall fit for Tate. Following this model, the Web team is responsible for the analytics strategy, overall management, gathering requirements, setting up reports and dashboards pulling together data arriving from a range of analytical tools, communicating the finding to decision makers and making recommendations based on findings, and training others in the organisation on how to use analytical tools.
We are now in the process of seeding the analytics culture across the organisation and are training people across different departments and projects to empower them to be responsible for checking the metrics against their own Key Performance Indicators (KPIs), reporting on metrics to their teams on a regular basis, basing their decisions on the data they collect, and critically, communicating with the Web team when their KPIs have changed and the reports need to be modified.
Many departments contribute to Tate’s digital output, and the same contributors also played a part in the metrics definition process. As part of the website redevelopment project, we carried out a process of gathering the metrics requirements from departments responsible for marketing, learning, membership, research, fundraising, ecommerce and human resources to name but a few. Not only was this crucial in making sure an overarching analytics strategy was created, but it was also an important step in the journey of spreading the analytics culture.
One of the biggest issues we found was that not everyone involved was familiar with the basic terminology of analytics. To overcome this barrier, we had to reassess our communication with the stakeholders and provide training sessions to introduce them to the basic analytics. Another challenge we faced was setting up the targets, as these were being set up, in many cases, for the first time.
At the time of writing, we had already achieved some important outcomes: we had a list of micro departmental objectives and metrics that would be essential in defining KPIs and, what is a more important, a growing interest in analytics as demonstrated in an increase in number of requests for analytics reports.
Obviously, analytics KPIs must reflect your organisation's goals and objectives. The number of metrics that could be reported against each of these goals is vast and each requires a suite of metrics to be seen holistically, but creating a report with lots of metrics would not help the organisation identify the areas to act on. So, how do you decide to single out the KPIs that are most important? To help us work out which ones would give us the best insights into our online activity, we analysed every performance indicator using the following questions:
Figure 4 shows some examples of Tate’s website KPIs.
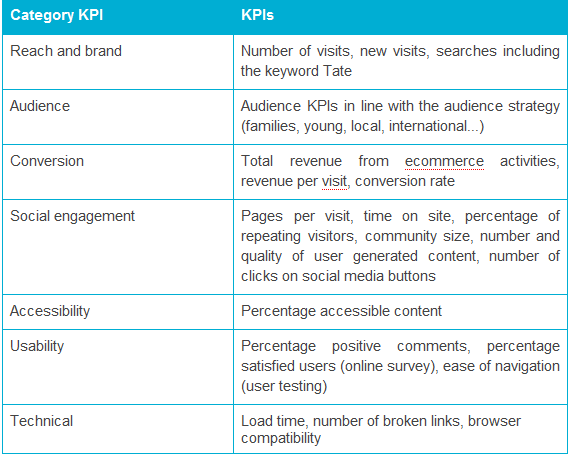
Figure 4: Example of website KPIs
For better clarity, the KPIs, and subsequently, the reports and dashboards, have been classified into strategic, tactical or operational depending on their degree of detail and management level and whether they are linked to high-level objectives or more specific ones (Eckerson, 2010). In addition, user segmentation – based on a number of criteria – has been applied to selected performance indicators. For instance, one segmentation is based on location, specifically London, Liverpool and St Ives (the locations of Tate’s four galleries) as well as international visitors (a strategic aim). Another is traffic source, essential for analysing activities such as social media, pay–per–click advertising or e-mail communications. Additional segmentation has been applied for areas of particular interest for current and future digital developments such as the use of mobile devices.
Regular analysis of our KPIs will reveal underlying trends and lead to action on specific activities or campaigns and help us evaluate the success of our online strategy and how it is delivering wider organisation objectives.
It is very likely you will already have more than one Web presence to manage. As you start encouraging social engagement on all your platforms and disseminating your content beyond your website, it becomes ever harder to measure user interactions and your activities against your KPIs. It therefore becomes crucial to have appropriate analytics measurement tools and expertise to capture and analyse just the right information for your organisational needs.
For analysis and reporting on website metrics, Google Analytics was an obvious choice, being a reliable, free and widely used analytics tool. Moreover, Google Analytics is becoming the de facto standard reporting tool in the museum sector (Finnis et al, 2011). However, Google Analytics comes as a box of Lego blocks that can be customised many ways. In order to make sense of this data, Google Analytics needs someone in your organisation or external consultant to tune it properly using all available settings: goals, segments and filters. Setting up the tool and tracking codes is a highly time–consuming task requiring significant knowledge and experience. However, investing time to set up at least some of the advanced settings would give you more insight to inform against your KPIs and to optimise user experience.
As social content on the Web increases, the biggest challenge all museums are facing is measuring the true value of their social media activities. At the time of our audit, Google Analytics offered only a limited insight into social media and real–time conversations. To find the right social analytics tool, we undertook a comparative analysis of the available tools and chose Hootsuite as it scored very high on all important features: the coverage of social networks, reporting options, brand monitoring tools, Facebook and Twitter metrics, and cost.
The next step on our journey will be the integration of these tools with other technologies, for example ticketing or bulk e-mail systems, to create a end–to–end analysis of the user’s journey across the multiple systems that deliver the digital experience of Tate. Until the magic tool, which would evaluate the whole online ecosystem, is invented, we all need to continue to invest in setting up and customising a variety of tools that will offer the best insights.
Good communication is a fundamental aspect of any mature analytics culture. The analytics reports are your main tools in communicating the results to the stakeholders and they should aim to aggregate and present the data in such a way to drive the decision–making process. There has already been positive feedback regarding the new analytics reporting at Tate. One–page reports showing the top–level metrics are now emailed to the whole organisation on a monthly basis and are made available on the intranet in the new section on online metrics.
In order to present the tactical and operational KPIs, which require a higher degree of detail and increased frequency, customised reports based on specific requirements have been set up. As mentioned before, this part of our analytics activity will be decentralised and training sessions have been planned for the year ahead, which will enable staff to create their own reports. It is equally important to ensure people are able to interpret the reports easily and understand the real value of the presented information. So, apart from distributing the reports electronically, we are increasingly communicating the results in meetings. For example, we have set up regular meetings to analyse the social media activity where a group of people responsible for managing different social media accounts are presented with the latest findings, which help them make decisions on which social media activities are worth pursuing and which are not (see Figure 5).

Figure 5: Example of social media metrics quantitative analysis.
So far in this paper we have explained the steps we have planned or have already taken to implement the culture of analytics at Tate. To test how the planned processes would work in real life, we worked with the marketing manager at Tate Liverpool to create a report for the exhibition, Alice in Wonderland. The exhibition was promoted offline and online and included Web banners, pay–per–click and social media campaigns, as well as advertisements in local newspapers. Exhibition–specific online content was created, including a series of blog posts, a video interview with the curators, a teacher’s pack, and the “Wondermind” game. Working in close collaboration with the marketing manager and following the exhibitions communication plan, the analytics tools were set up to evaluate specific areas of activity. The analytics tools used to detect the data for the final report included Hootsuite, Adwords, Google Analytics, Facebook Insights, ticketing system and YouTube analytics.
The final report summarised the most important and useful information for the team:

Figure 6: Alice in Wonderland exhibition report.
This exercise proved invaluable in helping us to determine the right management processes and how best to work with other departments. It also helped us assess the time and effort involved in setting up the tools and the production of customised reports. But most importantly, the report and its analysis received a useful feedback from the marketing team at Tate Liverpool as this quote clearly shows:
Your reports are allowing me create more effective marketing campaigns! … We're using your data to help increase income ... We're using your data to ascertain whether or not it is realistic to convert these online visitors into actual visitors to the gallery ... I thought your analysis of our social media was fascinating – it helps me best understand what content my 'followers' and 'likes' prefer – it will help me better plan content on social media going forward. Mostly, I'd just like to say thank you – your reports are incredibly helpful. I'm coming to the analytics master class in April – looking forward to it.
Jennifer Collingwood, Marketing Manager at Tate Liverpool
There is no doubt that our new approach to analytics has attracted positive attention from across the organisation and the future looks rosy (see Figure 7).

Figure 7: Situation in a near future.
To harness the current enthusiasm and to make sure that others are actively engaged, we plan a full roll–out of the analytics training programme. We are also exploring other communication channels because improved collaboration and mutual understanding will be instrumental in realising the full benefits of analytics. In addition, we will to continue to enhance our metrics to enable us to correctly measure and accurately report findings in a digestible, relevant and increasingly visible way to all within the organisation. The ongoing challenges for us will be to increase levels of investment and improve our analytics reporting, to keep the tools in tune with organisational objectives – both digital and physical – and to create new analytics–driven decision–making systems that will deliver great user experiences to our audiences.
Clifton, B. (2012) A 10–point check list to setup your Google Analytics properly. Available
http://www.advanced-web-metrics.com/blog/2012/01/03/google-analytics-implementation-checklist/
Eckerson, W. W. (2010). Performance dashboards: measuring, monitoring, and managing your business. New York: Wiley.
Finnis, J., S. Chan, and R. Clements. (2011) Let's get real: how to evaluate online success? Last consulted January 18, 2012. Available at: http://weareculture24.org.uk/projects/action-research/
Hamel, S. (2009) The Web analytics maturity model. A strategic approach based on business maturity and critical success factors. Last consulted January 25, 2012. Available at: http://www.cardinalpath.com/cpwp/wp-content/uploads/WAMM_ShortPaper_091017.pdf
Kaushnik, A. (2007). Web analytics: an hour a day. New York: Wiley.
Stack, J. (2010) Tate Online Strategy 2010–2012. Last consulted December 10, 2011. Available at: http://www.tate.org.uk/research/publications/tate-papers/tate-online-strategy-2010-12
Usher, N. (2010) Why SEO and audience tracking won’t kill journalism as we know it.
Available http://www.niemanlab.org/2010/09/why-seo-and-audience-tracking-won%E2%80...